Monitoring
When running your server, you in most cases want to get key insight into the performance of your server. This can be used to monitor things like CPU and memory usage, as well as harddrive, network and much more.
For this, we are going to use a system called Prometheus to scrape the server for details, and then present the data in a dashboard called Grafana.
To set this up, first go to Tools on your server, and install the tool called Prometheus and Grafana.
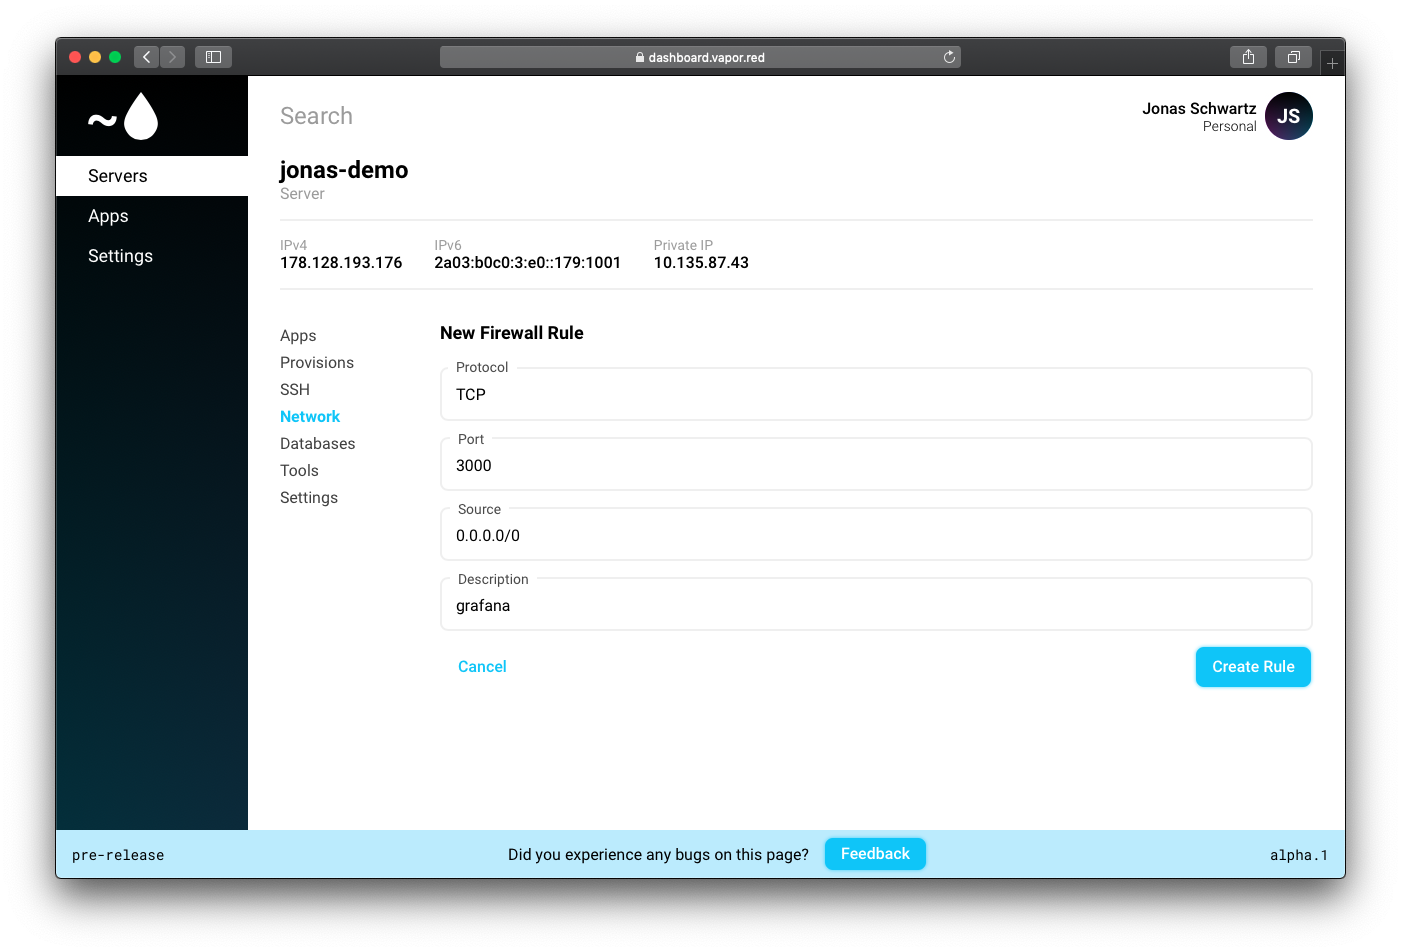
When this is done, open up port 3000 in the firewall to the source 0.0.0.0/0
Now we can access http://server-ip:3000
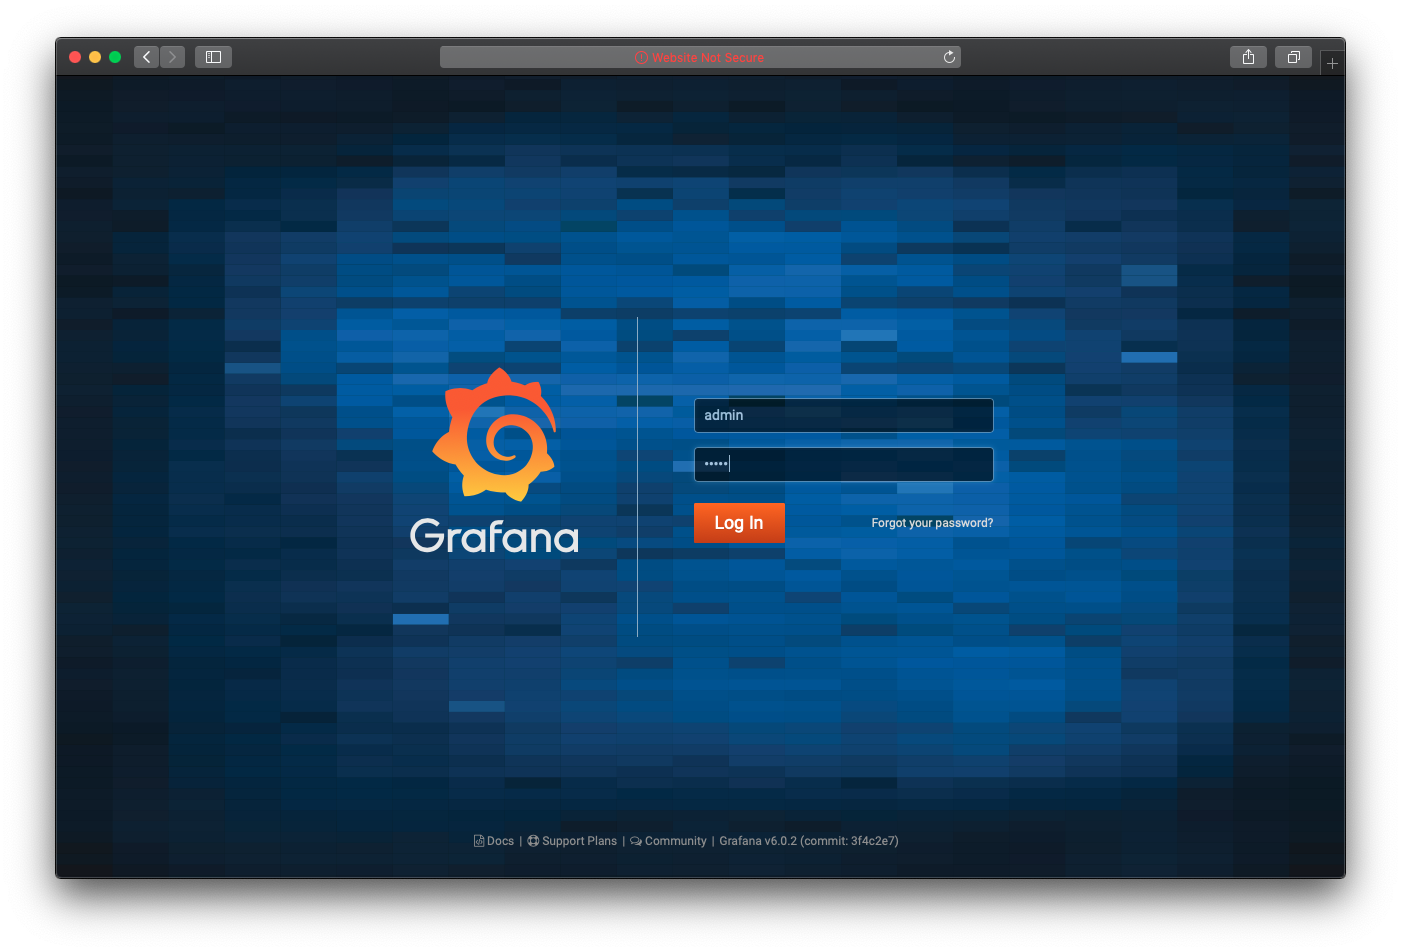
First you want to sign in. This is done using username/password of admin/admin
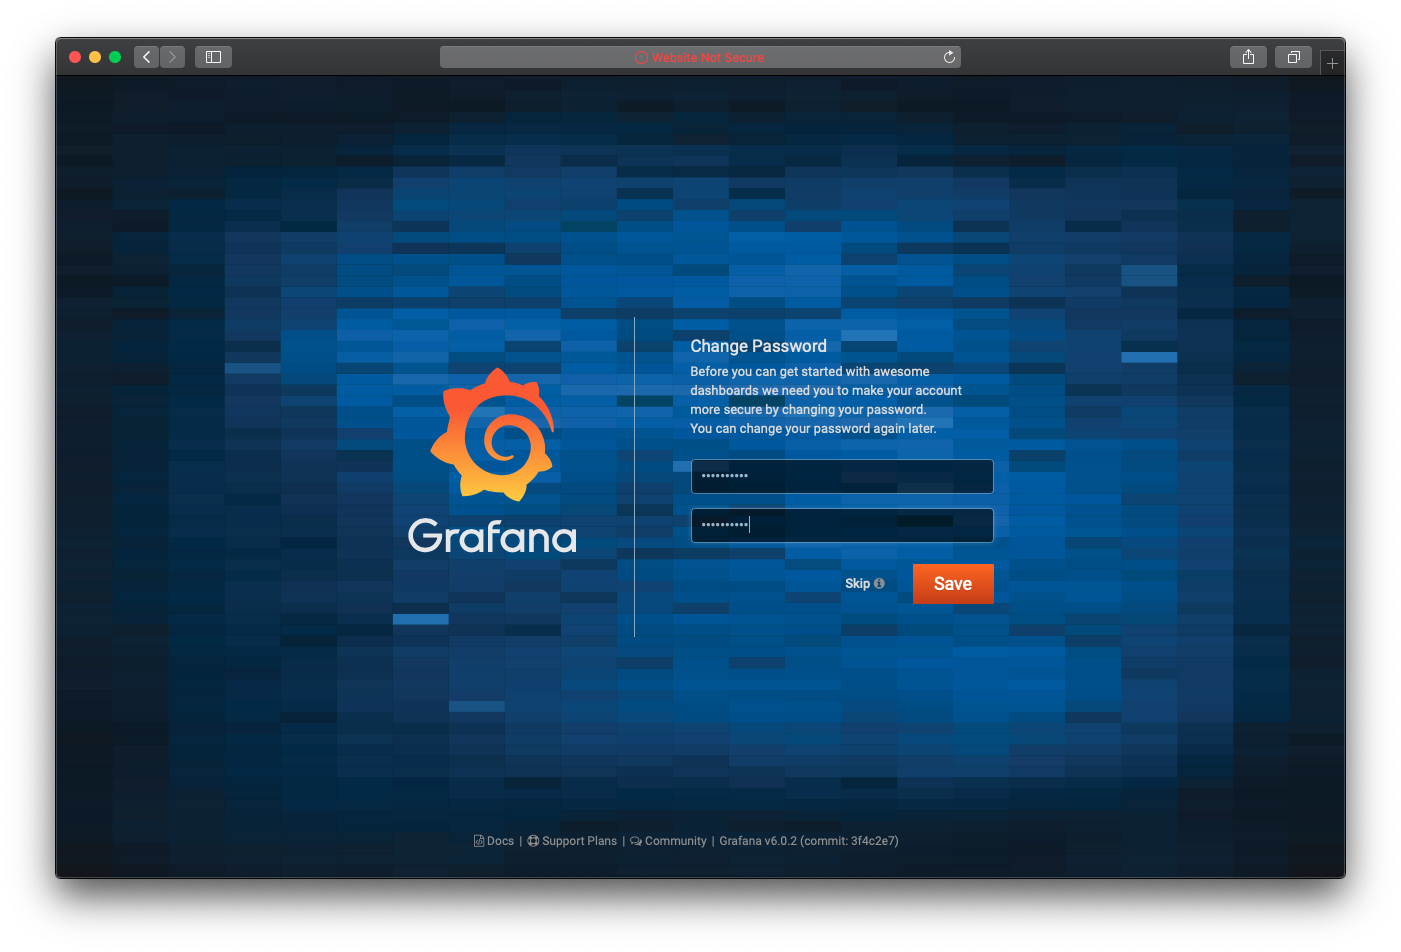
Next page you are ask to update the admin password, make sure you select a strong password here.
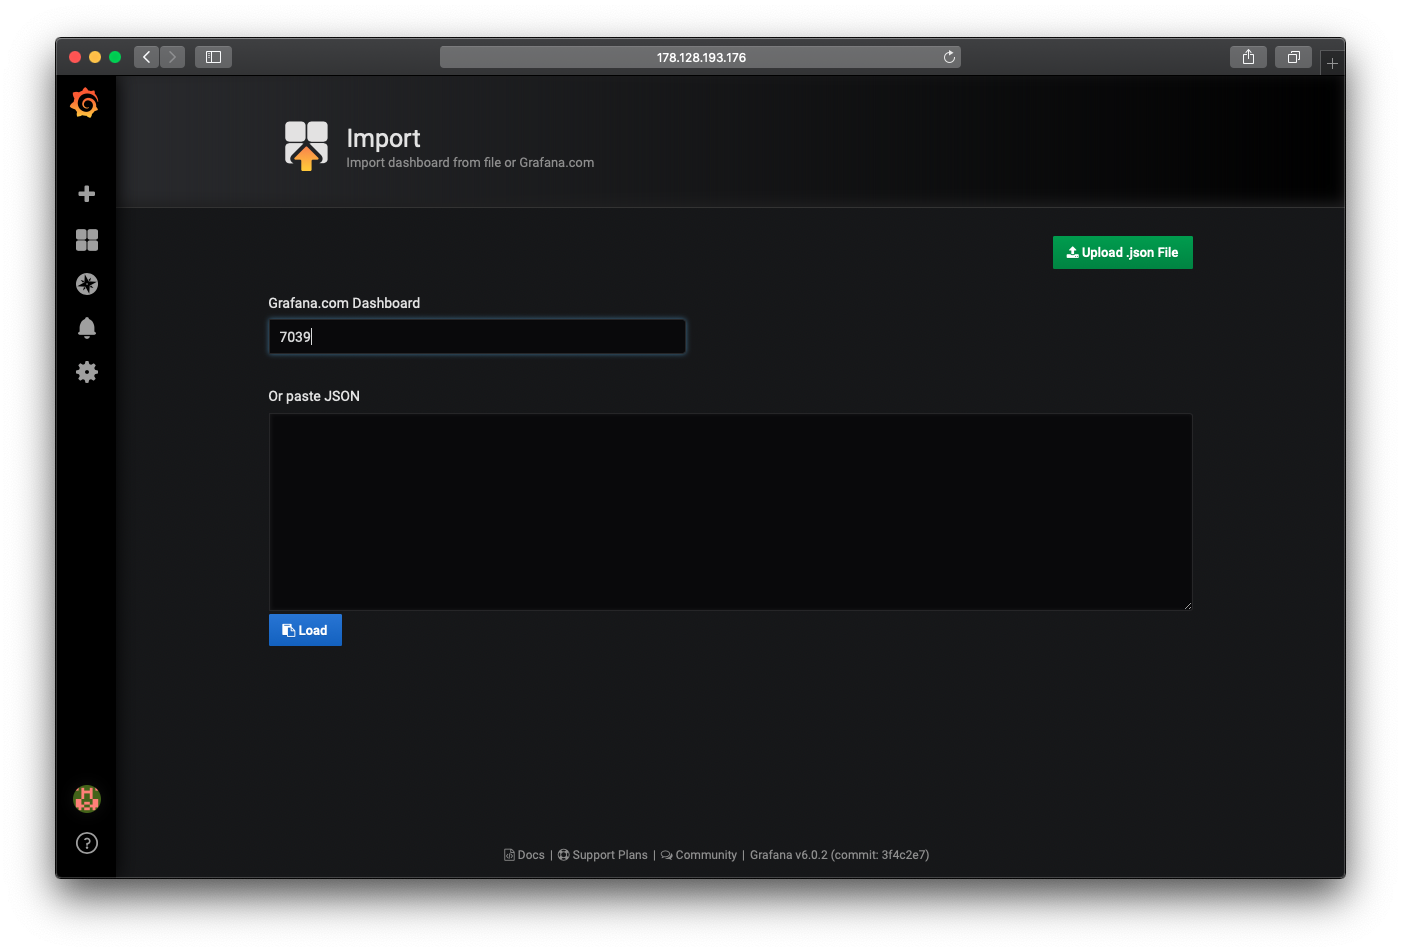
Once we are logged in, we can now add a Dashboard. There are a lot of community dashboards for Grafana. A good start is using a dashboard with the ID 7039
Click the + button in the menu, and click Import. Here enter the ID
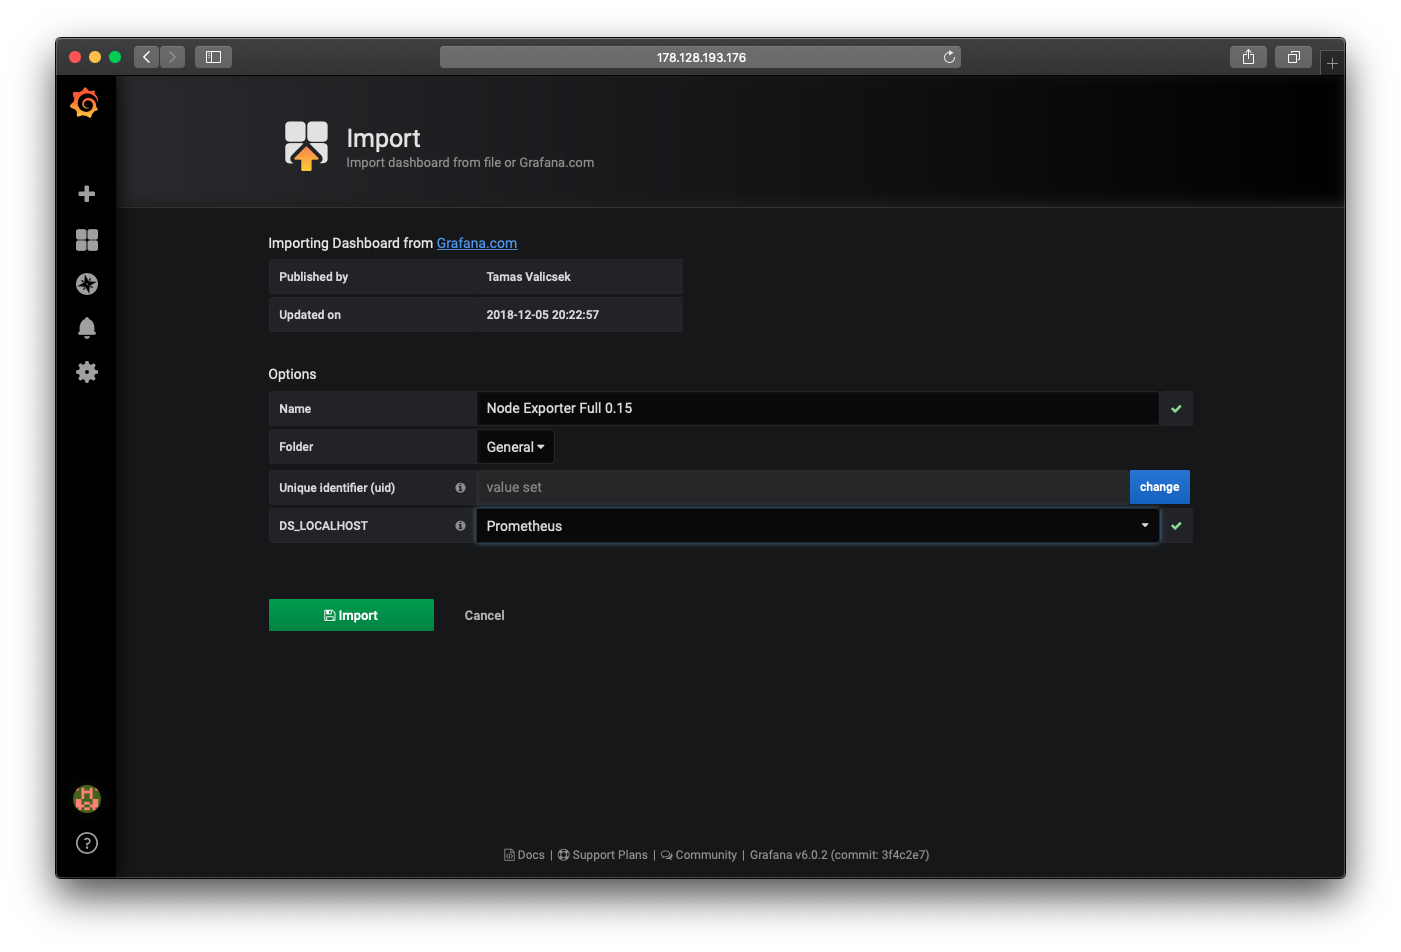
And now finally, you are asked to setup the dashboard, in the last form element, DS_LOCALHOST select Prometheus
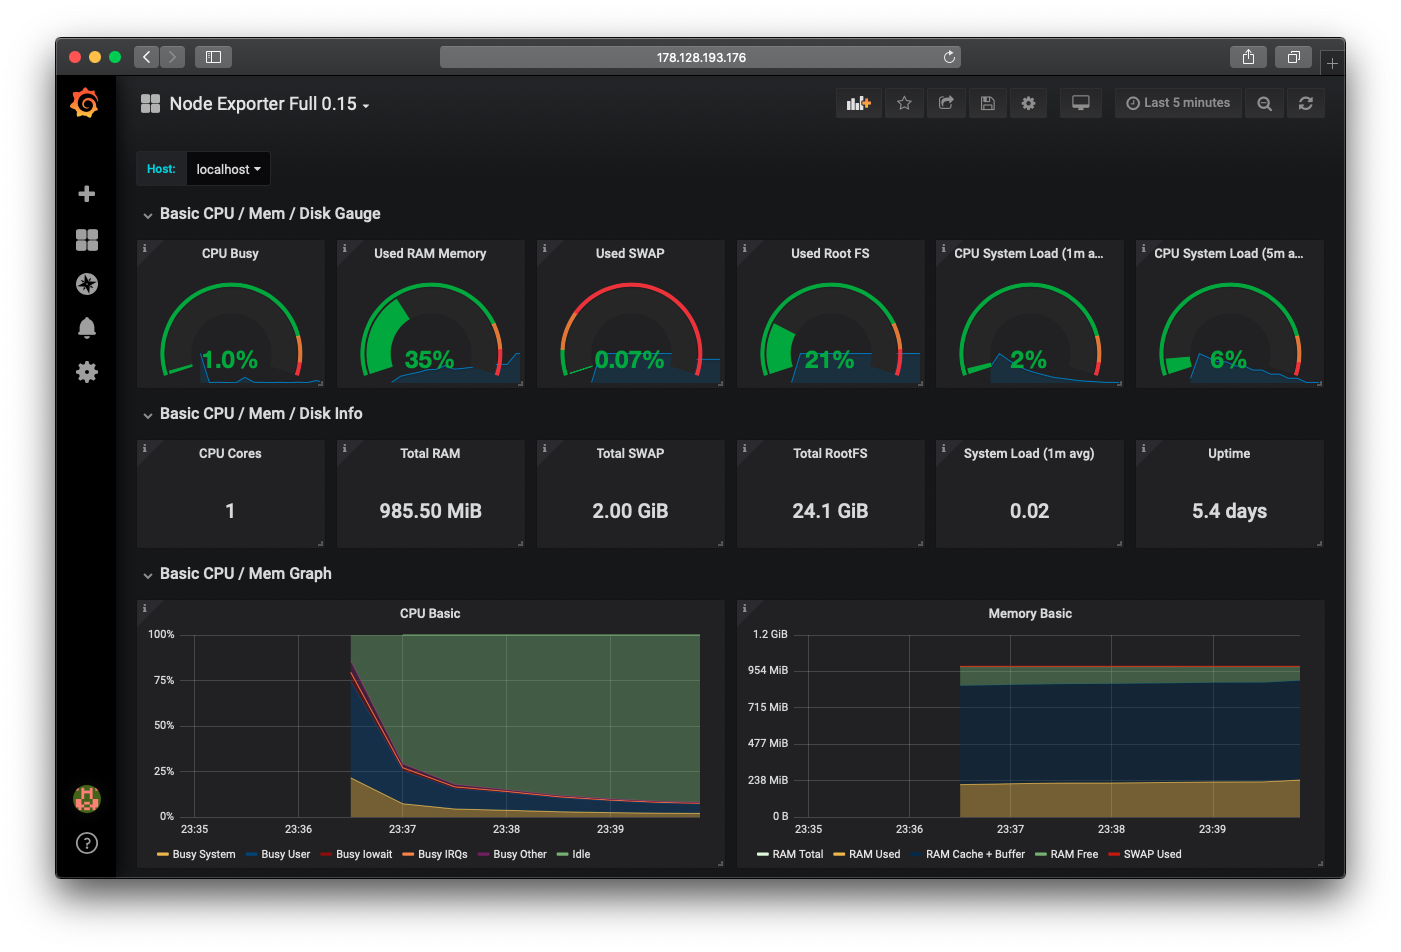
You are now lead to your Dashboard. Grafana comes with a lot of configuration elements, and we strongly recommend you try to look through the system, and get to know the system if you never have tried it before.